In touting his latest proposal to raise taxes on North Carolinians, Democratic state Sen. Wiley Nickel recently offered this claim:
“North Carolina Republicans have rigged the system so that those in the Top 1% pay a lower share of state and local taxes than the Bottom 99%. The wealthy need to pay their fair share so we can invest in public education, affordable health care and our state’s crumbling infrastructure. My bill would roll back Republican tax cuts on families making over $500,000 per year. We have an upside down tax system that lets the Top 1% pay a lower share of their taxes than teachers, police and fire-fighters. That’s just wrong.”
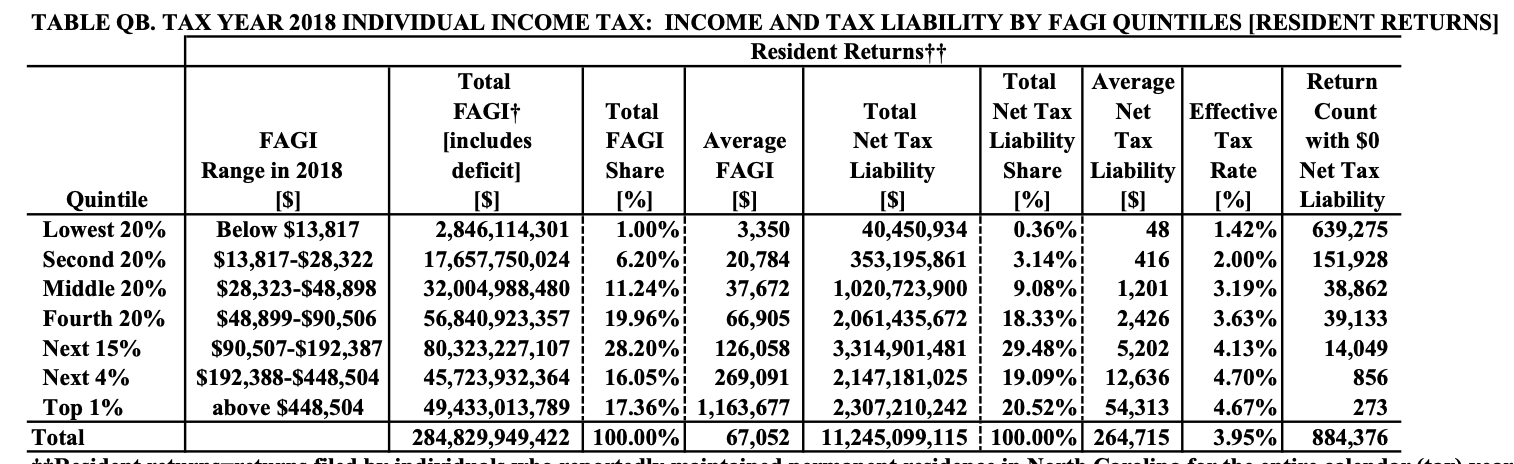
What’s “just wrong” is the notion that the top 1% of taxpayers pay a lower share of the tax burden than the other 99% of taxpayers. My fiscal expert colleague Joe Coletti pointed me to this chart from the “Statistical Abstract of North Carolina Taxes 2019.”
Joe offers this additional information: “This is just income tax. Add property tax, and it jumps. Add sales tax, and it skews a bit the other way.” By “jumps,” he means the share of the tax burden borne by those with the highest incomes increases.
The chart tells the story, but in case you don’t want to strain your eyes: The top 1% of N.C. taxpayers earn more than 17% of the income and pay well over 20% of the state’s income tax.
Divide the state’s taxpayers into five groups based on income, and the numbers break down this way:
- The top 20% earn more than 61% of the income and pay 69% of the income tax.
- The second 20% earn 20% of the income and pay 18% of the income tax.
- The middle 20% earn 11% of the income and pay 9% of the income tax.
- The next 20% earn 6% of the income and pay 3% of the income tax.
- The bottom 20% earn 1% of the income and pay less than 0.4% of the income tax.
As for the effective income tax rate — the rate you get when you divide your tax bill by your income — the average rate for those in the bottom 20% is 1.42%. For the top 1%, that rate stands at 4.67%.
As for “average net tax liability,” those in the top 1% owe $54,313, compared to $48 for those earning the lowest incomes, $416 for those among the second-lowest 20%, $1,201 for the middle 20%, $2,426 for those in the next 20%, $5,202 for those in the next 15%, and $12,636 for those in the top 5% of income but outside the top 1%.
If that’s a rigged system, it sure doesn’t seem rigged in favor of the top 1%.