Just how misleading are the Cooper administration and media reports about “record hospitalizations” and possibly using them to justify shutting down everything again and/or forcing everyone to wear face masks?
This misleading:
- those record highs are far below even the best-case scenario highs projected in March
- rising hospitalizations in June were considered a good sign that we had flattened the curve (and not seen the spikes in April or May).
My latest Research Brief helps remind us:
In other words, an increase in hospitalizations in mid-June is a feature, not a flaw. What’s changed?
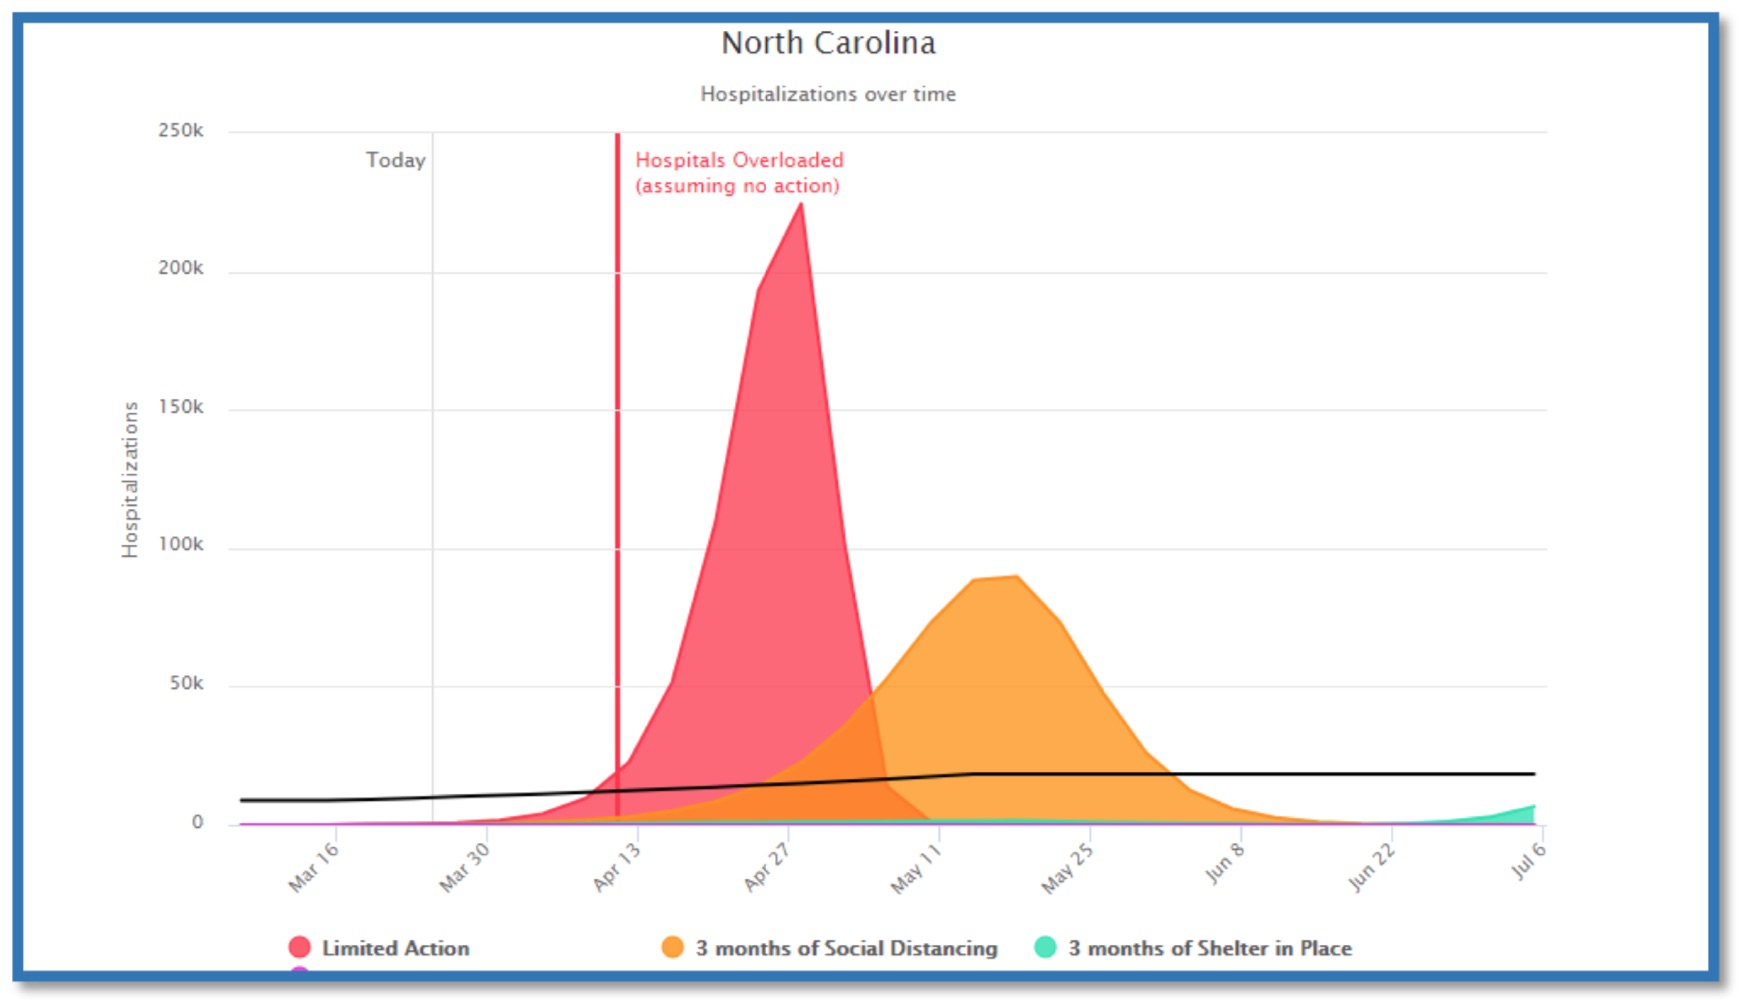
Let’s go back to March 26, the day before Gov. Roy Cooper dropped his stay-at-home executive order. The General Assembly’s House Select Committee on COVID-19 heard testimony from representatives of the North Carolina Medical Society (NCMS). The society presented the General Assembly with a report on “COVID-19: Analysis and Response.”
In her testimony, NCMS board member and Duke University professor Dr. Eileen Raynor highlighted a graph from that report. Here is that graph:
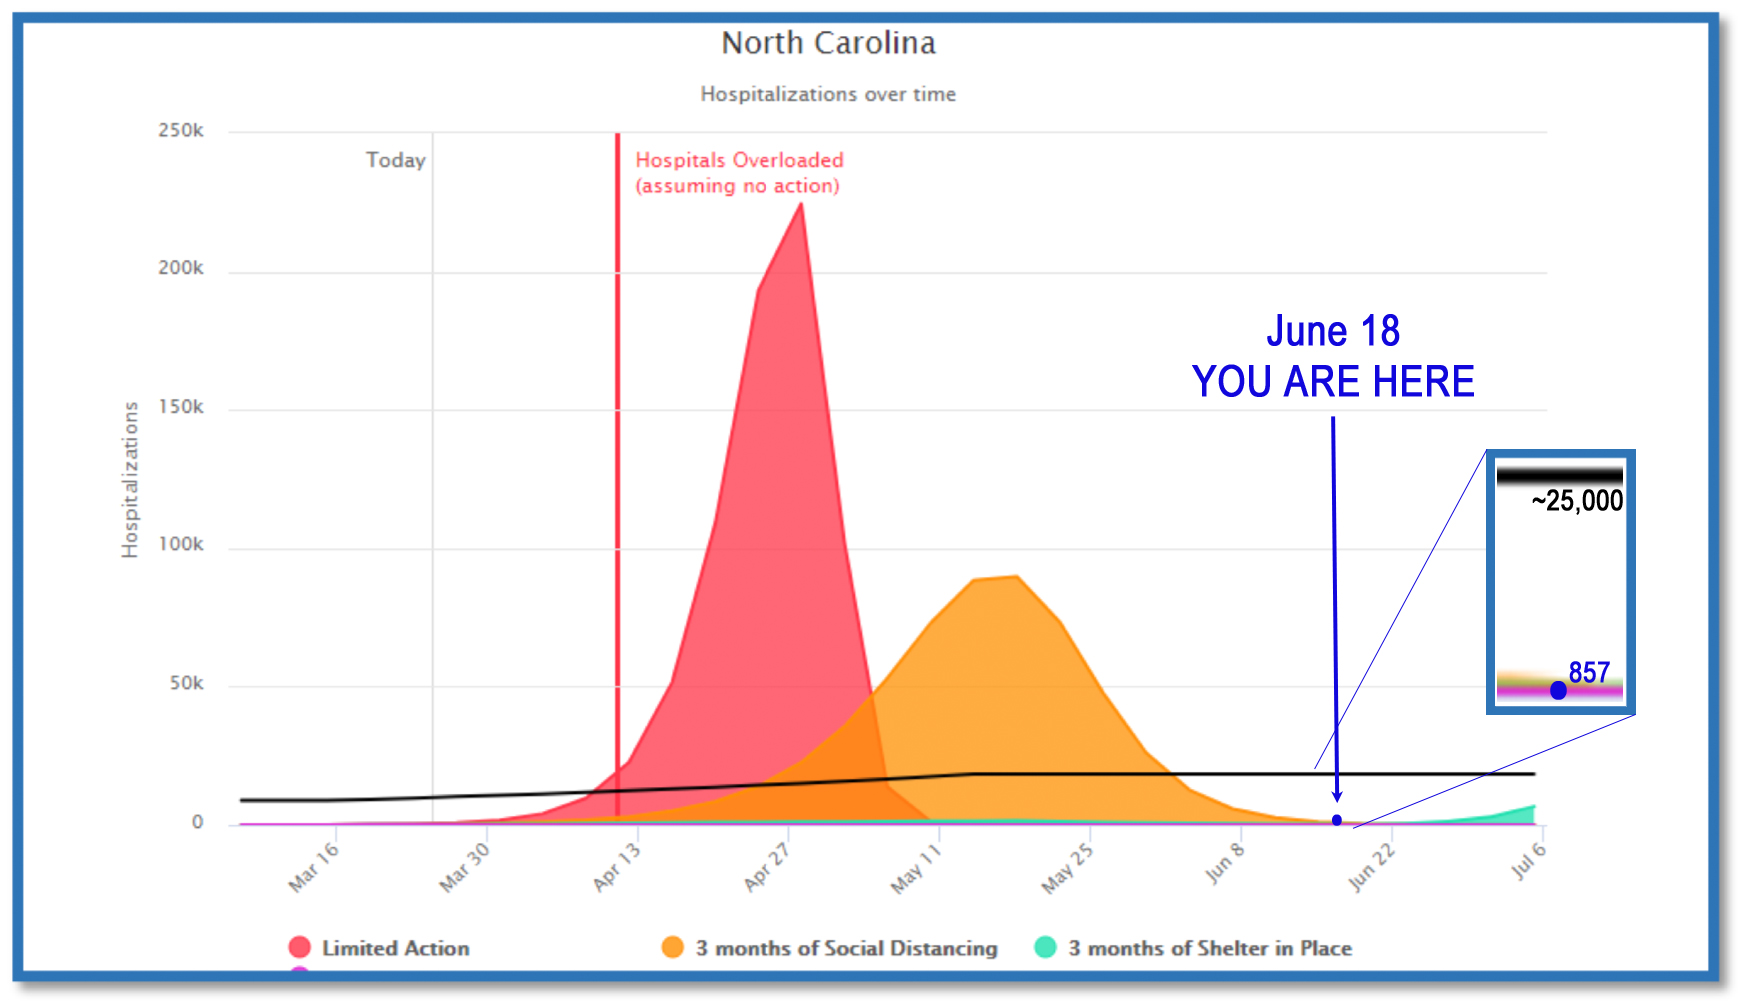
… To recap, here are the graph features — and where we are as of June 18:
- Dark black line: Hospital bed capacity, “approximately 25,000”
- Red peak: The “minimal action” projection: hospitals overwhelmed by an order of magnitude, approximately 225,000 hospitalizations by the peak in late April
- Orange peak: The “social distancing” projection: hospitals overwhelmed by a much smaller magnitude, approximately 90,000 hospitalizations by the peak in mid-May
- Blue peak: The “stay-at-home” projection: hospitals never overwhelmed, approximately 12,000 hospitalizations by the peak in early July
- June 18: Real-time data as of June 18, after recording the 10th record number of hospitalizations this month: 857 hospitalizations
If I were to update the chart for today, here’s how that would look:
Read more here.