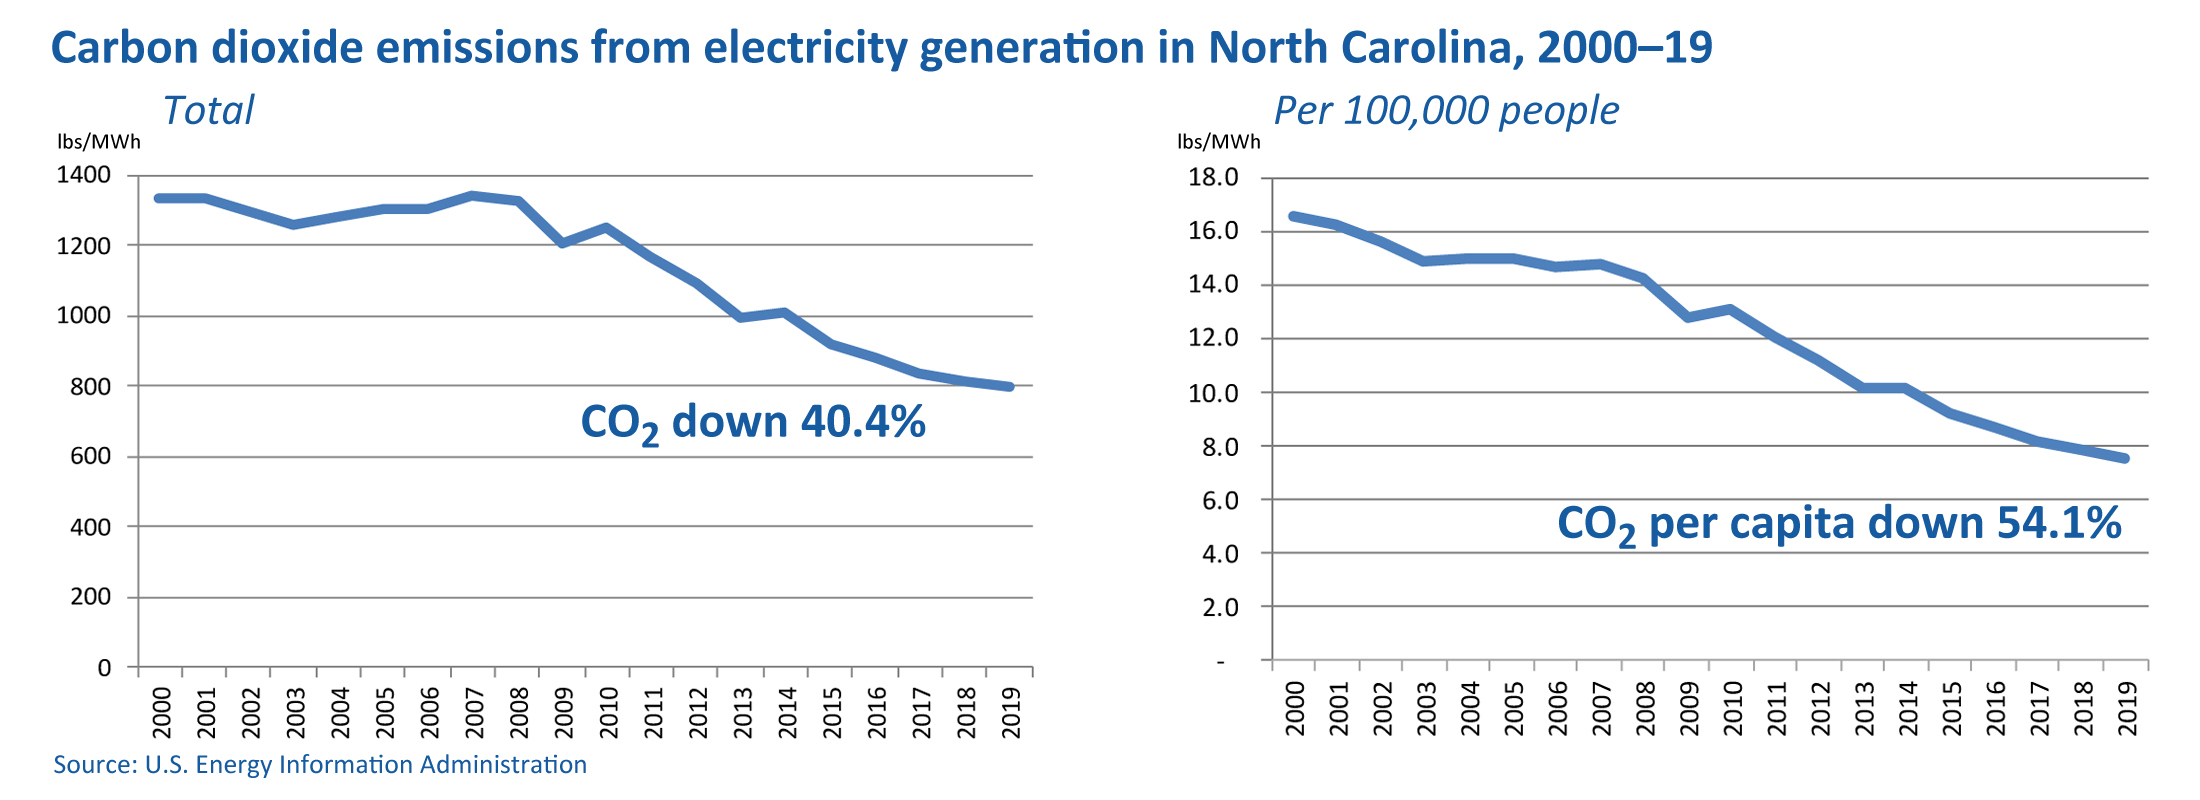
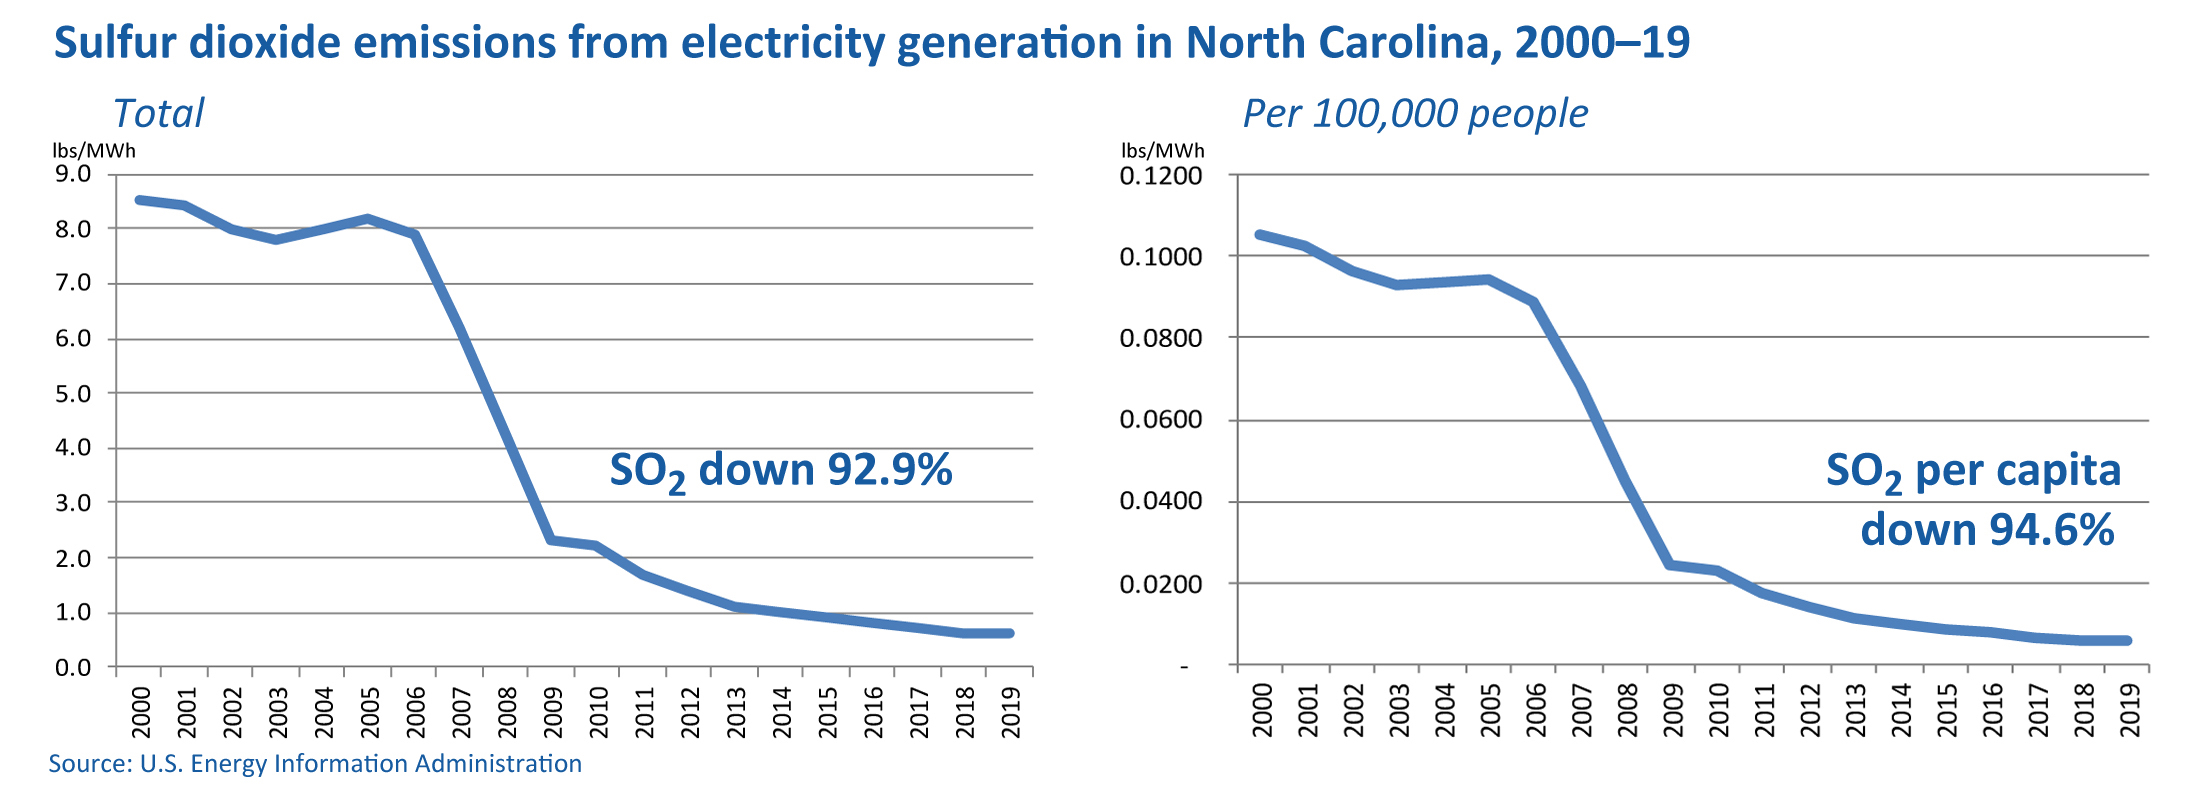
Here are the charts featuring North Carolina’s energy-based emissions across the course of this century. I discussed these data yesterday.
I chose to look at emissions per capita also. I remembered the finding last year that U.S. CO2 emissions per capita were at their lowest rate since 1950.
Here are the charts. Click the images for a larger size: