Some findings are persistent, and this is one of those persistent findings, unfortunately. Counties with high poverty, unemployment, and property tax rates also tend to have high lottery sales per adult.
Take the poverty rate, for instance. Across North Carolina, the poverty rate was 14.7 percent. In the 20 most economically well-off counties, it was 12.5 percent. The next 40 counties, 15.6 percent. The least economically well-off counties, 21.2 percent.
For the top 10 counties in lottery sales per adult, the poverty rate was 21.4 percent.
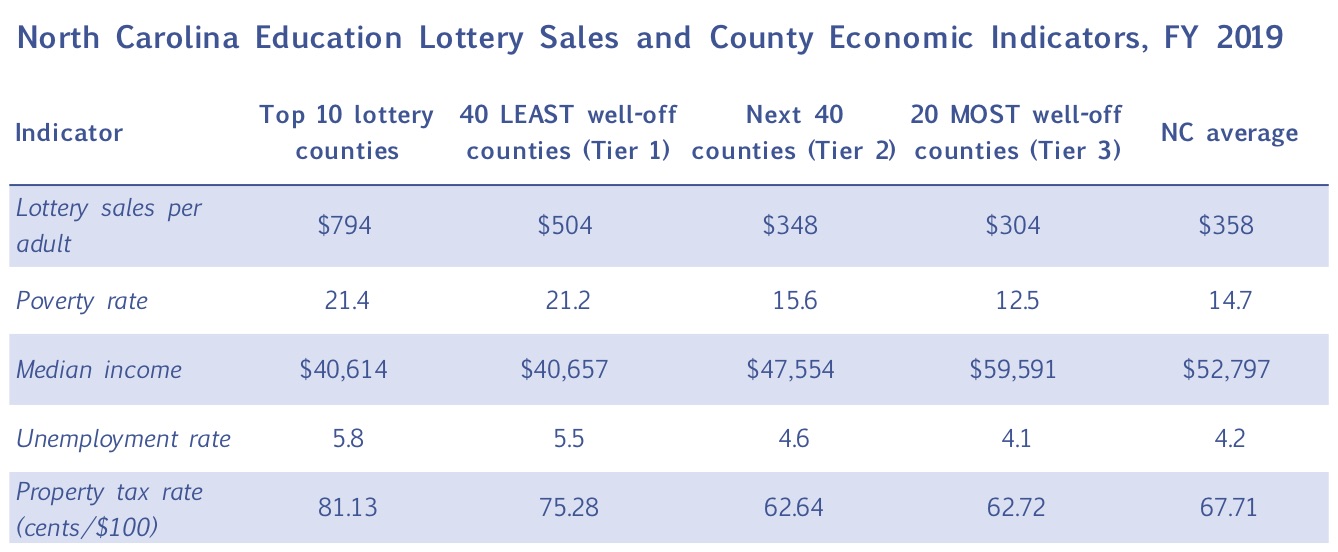
Click the graph for a larger size. Data sources (most recent available): NC Education Lottery (Fiscal Year 2019 sales); NC Commerce Department (2019 Tiers); US Census Bureau (adult population 2018, poverty rate 2017, median income 2017); US Bureau of Labor Statistics (unemployment July 2019); NC Department of Revenue (property taxes 2018-19).
And what about lottery sales per adult? The state average was $358 per adult. In the 20 most economically well-off counties, it was $304 per adult. The next 40 counties, $348 per adult. The least economically well-off counties, $504 per adult.
For the top 10 counties in lottery sales per adult, where the poverty rate was 21.4 percent, lottery sales were $794 per adult. That’s over two and a half times more than they were in the 20 most economically well-off counties.