Vox blares the following headline and subhead today:
This chart explains why Americans are so angry about health care
And why they’re becoming more open to the idea of single-payer.
Does it, though?
This chart has an interesting starting point. The year 2008? Some oldsters may still be around who remember that health care costs were a major issue in the presidential campaign of 2008. People thought it was too expensive then — and they worried how people worse off than themselves could afford it.
They might even remind people how the government got super heavily involved (more so than ever before) in health care, despite warnings from economists and free market experts that government super involvement in any market tends to result in fewer choices, worse options, and … higher prices.
They might remember being promised by The News & Observer editors that “it will work and people will like it and wonder why it took so long to put something as sensible as the Affordable Care Act into place.”
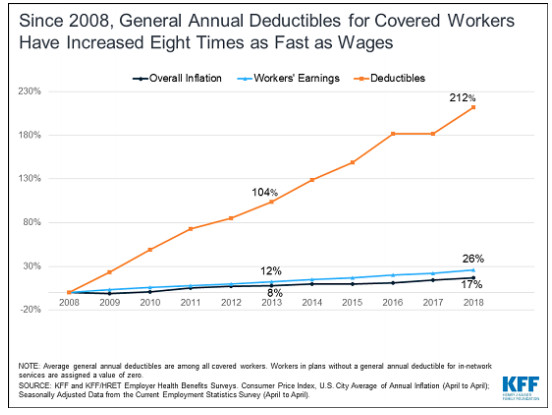
Anyway, here’s the chart:
From the article:
This chart shows that, over the past decade, the size our insurance deductibles have skyrocketed. Deductibles have grown by 212 percent since 2008 — eight times faster than wage growth, and 12 times faster than inflation. …
Just a decade ago, the average American with employer-sponsored coverage had a deductible of $303. Flash forward just one decade, and that number now sits at $1,350.
What this means is that Americans who do need medical care are being asked to spend significantly more to get it. There is a growing number of Americans who have to spend more than $1,000 on medical bills before their health insurance coverage kicks in.
Something happened in health care policy after 2008. What was it?