One of the outstanding features of the 2016-17 State of Teaching Profession Report is that it includes teacher vacancy data for the current school year. The definition of a “vacancy” is important in this case.
For the purposes of this report, NCDPI defined a teacher vacancy as an instructional position (or a portion thereof) for which there is not an appropriately licensed teacher who is eligible for permanent employment. Instructional positions that are filled with long-term substitutes, retired teachers, or provisionally licensed teachers would be counted as vacant by the LEA, because these employees are not lasting solutions to the vacancy issue and are only stop-gap measures (in most cases) employed by the LEA until a full-time, permanent, fully-licensed teacher can be found. Because of our approach to teacher vacancy, one should not assume that positions that are listed as vacant lack a teacher, but that the position is being covered by the best possible interim teacher until a more appropriate solution can be realized by the LEA. (Emphasis added.)
I would add that we should not assume that the temporary teacher is necessarily worse than the “more appropriate solution,” particularly if the district hires a retired teacher to address a vacancy.
Anyway, the statewide vacancy rate on the 40th instructional day for 107 school districts was 1.5 percent. (A few districts submitted data with inconsistencies, so they were omitted.) Anson, Hyde, Elizabeth City-Pasquotank, Martin, and Craven counties had the highest vacancy rates. Twelve districts reported zero teaching vacancies.
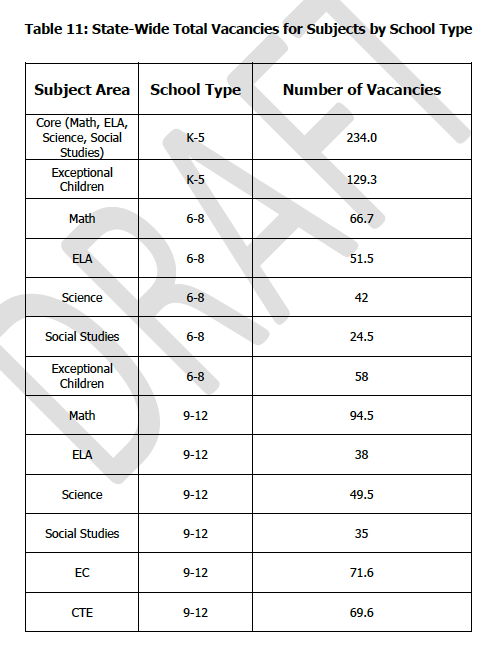
Subject- and grade-level vacancies are outlined in the chart below. Core elementary teachers, special education teachers in elementary schools, and high school math teachers had the highest number of vacancies.