Read about this in my Spotlight report on The Market Forces Behind North Carolina’s Falling Emissions.
If you’d like a hint, these charts:
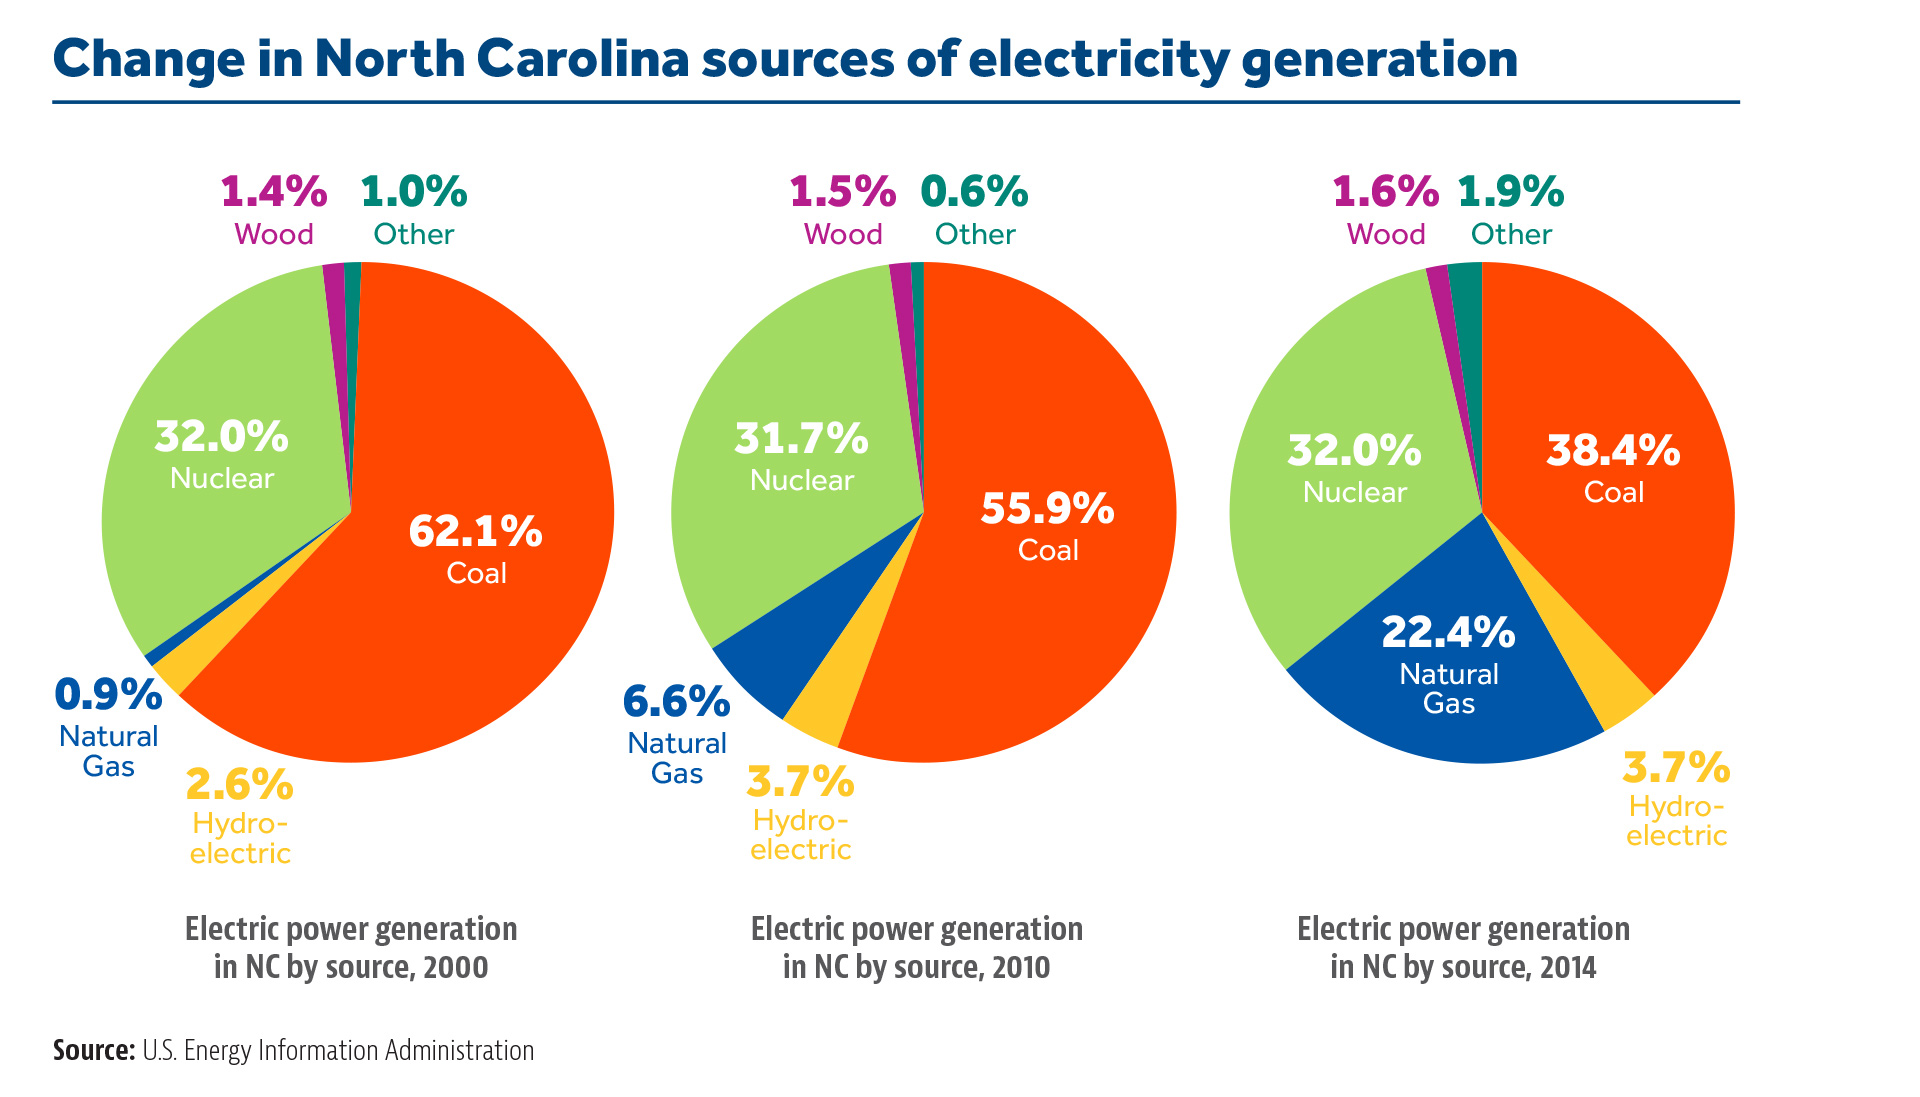
go a long way toward explaining this graph:
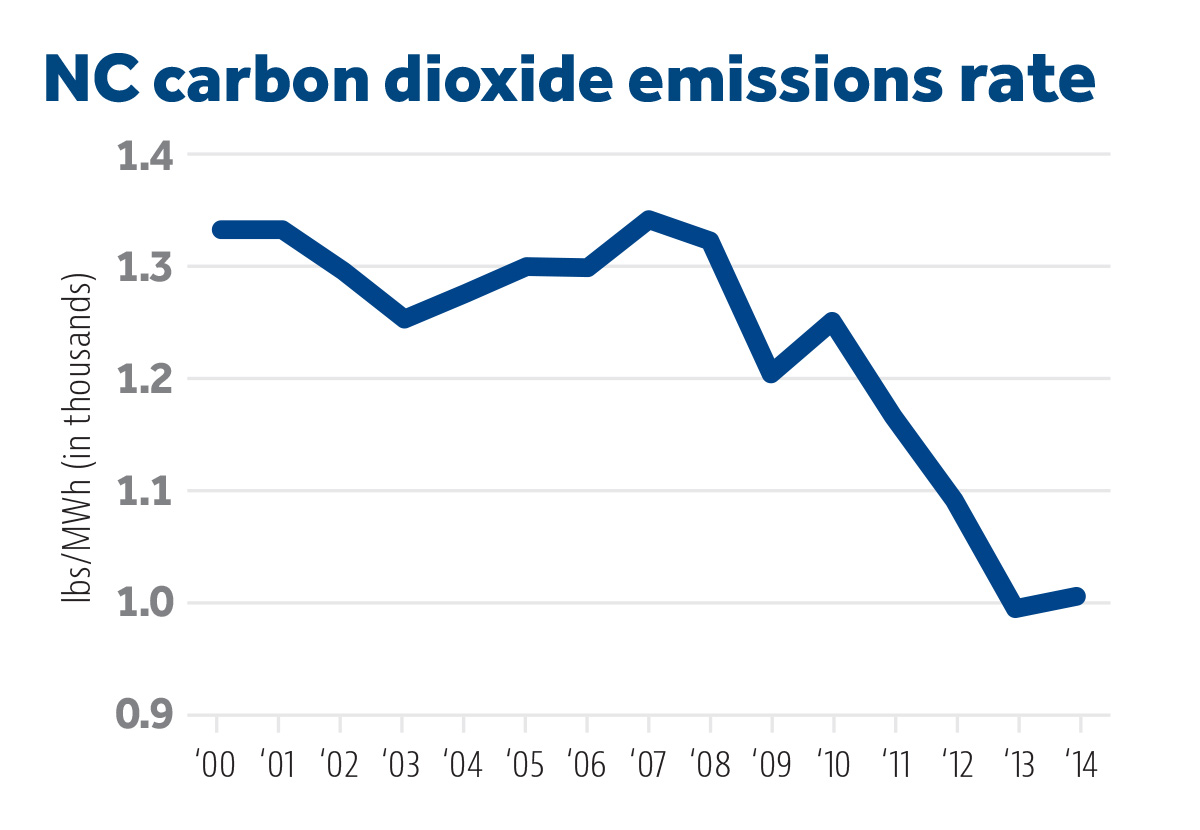
Read about this in my Spotlight report on The Market Forces Behind North Carolina’s Falling Emissions.
If you’d like a hint, these charts:
go a long way toward explaining this graph: