Three days after a CarolinaJournal.com Daily Journal chided the News & Observer for implying that North Carolina’s “cringe-inducing” 1st and 12th congressional districts can be attributed to Republicans’ efforts to gerrymander electoral maps in their favor, the N&O‘s editorial page compounds the mistake: An editorial today turns the implication into a direct accusation.
As can be seen by the maps of the 1st and the 12th districts, district lines were contorted to generate the maximum number of districts that would favor Republican candidates.
The problem with that statement is the same problem identified three days ago at CarolinaJournal.com.
Here’s the problem: Versions of those two districts predate Republican control of the N.C. General Assembly by 20 years.
The 1st and 12th Districts first emerged in close approximations to their present forms for the 1992 election. A federal order forced North Carolina to draw two majority-minority congressional districts after the 1990 census.
Democrats who controlled the General Assembly at the time created a 1st District with tentacles creeping far enough from its northeastern North Carolina base to encompass as many African-American voters as possible to meet the feds’ mandate. Meanwhile, the new 12th District stretched from Durham to Gastonia, often traveling a path that looked a lot like Interstate 85.
Ten years later, Democrats again had the power to draw election maps. They maintained the same basic forms of the 1st and 12th Districts, although the 12th now covered a little less territory. It stretched from Greensboro to Charlotte.
Republicans gained their first opportunity to draw election maps to their advantage after winning control of the General Assembly in 2010, the same year as the latest census. While the GOP-led legislature made other major changes to congressional maps, the 1st and 12th Districts maintained their same basic shapes.
If the News & Observer wants to argue for the superiority of congressional election maps drawn by retired judges, the newspaper ought to compare those maps to the most directly comparable set of maps drawn by Republican legislators for partisan advantage.
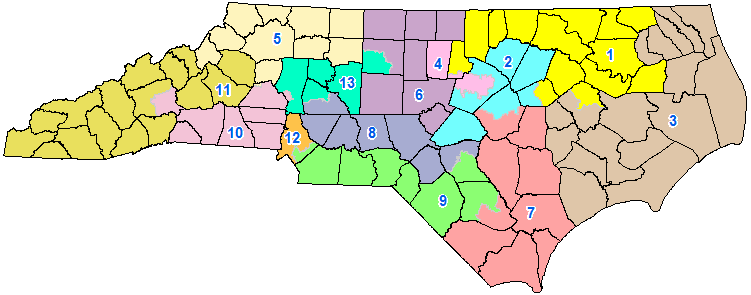
GOP maps drawn this year to produce 10-3 Republican majority within the U.S. House delegation:
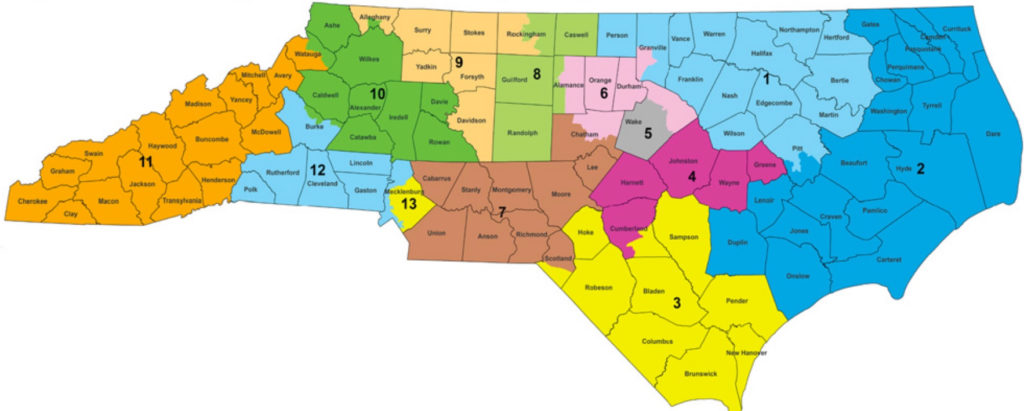
Maps drawn by retired N.C. judges, which would reportedly lead to the election of six Republicans and four Democrats, with three “toss-up” districts:
One suspects that preference for one set of maps over another has far more to do with the likely electoral outcome than with the appearance of the districts.