The Education Value Added Assessment System (EVAAS) is a computer program developed by SAS that tracks growth in student test scores from one year to the next. There is a reasonable expectation that students will demonstrate growth every school year, regardless of their starting point or demographics. According to the website, “SAS EVAAS analyses show no correlation between students’ growth and their socioeconomic status. Therefore, whether students are designated economically disadvantaged or not, they are equally likely to make good progress.”
The EVAAS public site offers a number of tools to analyze student growth. I went straight to the “Percent Economically Disadvantaged Students vs Growth Index” comparison for the 2014-15 state tests. Here is a scatterplot of the comparison:
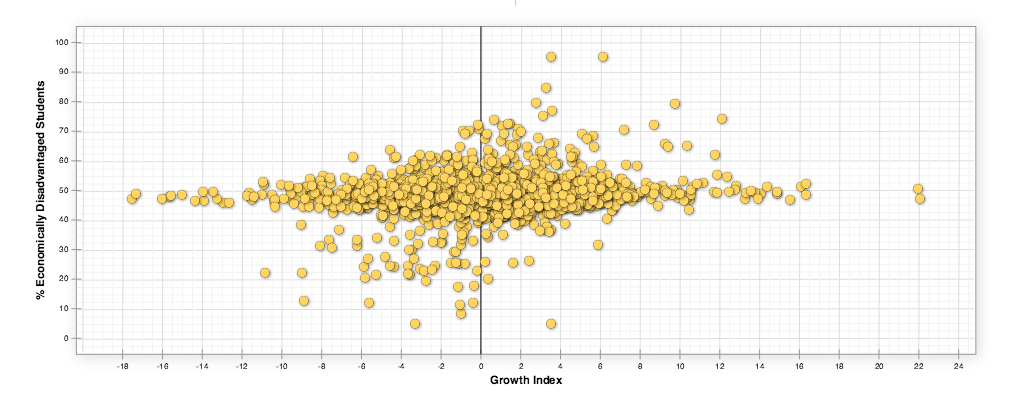 Each dot represents a public school in North Carolina. Schools in the bottom left quadrant are those that have a low percentage of disadvantaged students and negative growth. The conventional wisdom says that schools with few disadvantaged students should be doing extremely well, but many of the schools in this quadrant are alternative schools for struggling students.
The most important group of schools are those in the top right quadrant. They are the schools with positive growth and a high percentage of disadvantaged students. There are mostly high schools, early colleges, and magnet high schools in that area.
Most of the state’s schools cluster around the midpoint of the two axes.