Alex Adrianson of the Heritage Foundation’s “Insider Online” focuses attention on the debate surrounding dynamic, rather than static, analysis of government’s tax and spending proposals.
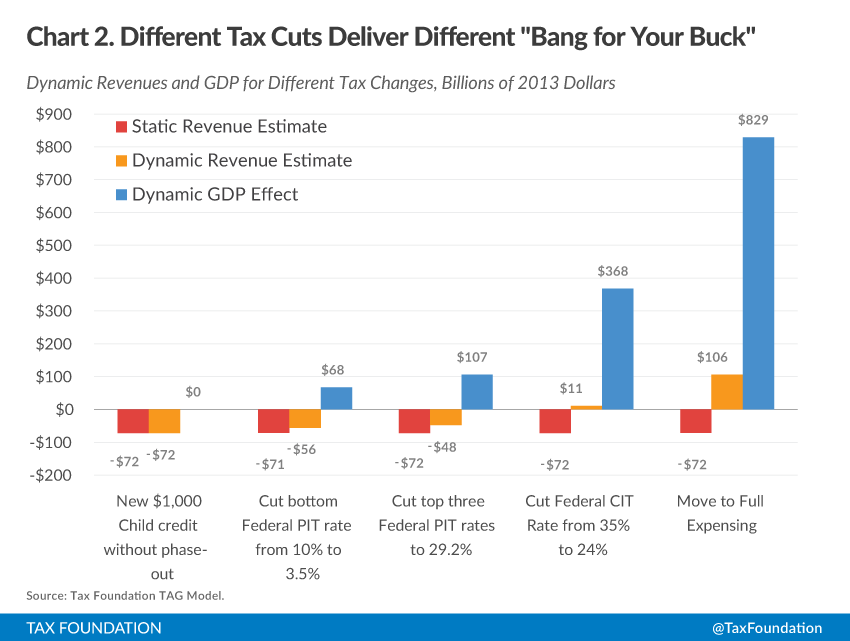
Some tax cuts are definitely better than others, and the following chart from Scott Hodge of the Tax Foundation—based on the foundation’s own Taxes and Growth model—shows why Congress needs to use dynamic analysis in making tax policy.
For those unfamiliar with the term, dynamic analysis considers not just how a change in tax policy will take a bigger or smaller bite of a fixed-size economy, but how the change in policy will affect the size of the economy, too. A tax cut that produces economic growth will at least partially pay for itself, because the lower rates will apply to a larger economy.
But which tax cuts help the economy most? The chart … shows five different tax cuts that each cut nominal taxes by $70 billion dollars. The model shows that allowing full expensing of new capital investment generates a boost in GDP that is twice the size of any of the other policies. Moreover, it is the only tax cut that generates increase[d] revenue.