This is puzzling.
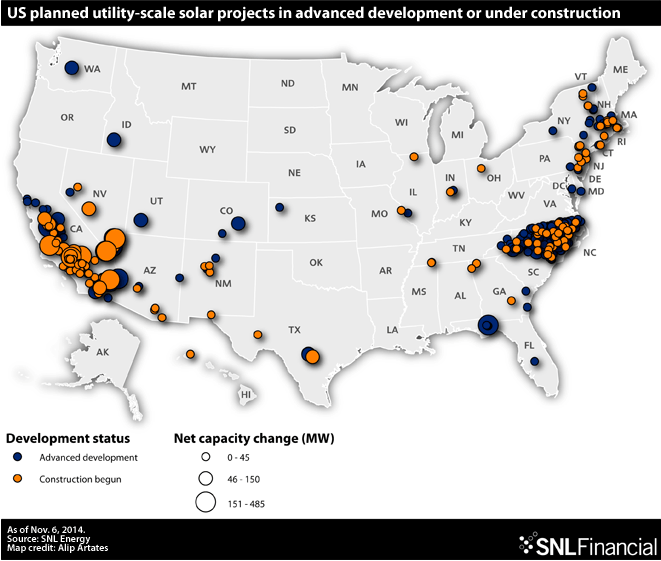
Yep, that’s a map of major solar projects across the country. Notice anything odd?
Why on earth do we have such a high concentration in North Carolina? We don’t have the sort of environment that naturally lends itself particularly well to solar like Arizona. We don’t have the largest population and consequently dramatically higher demand for energy. Why is there almost nothing in our bordering states and all this activity here? Something fishy bust be going on.
There are a couple of explanations. First we have Senate Bill 3 (SB3), the Renewable Portfolio Standard, which requires utilities to provide 12.5% of electricity to customers from renewable sources like solar.
But the bigger factor is generous state subsidies including at 35% corporate tax credit.
As the map so clearly shows, North Carolina is clearly developing far more solar projects than the market would deliver. That’s due to these subsidies, and there are a couple of problems with that. Of course, if they’re dependent on taxpayer money, then when the subsidies dry up, the projects likely will, too. And in the meantime, taxpayers are stuck funding expensive solar and associated increases in the cost of energy, rather than using less expensive sources like the states around us. All of that leaves North Carolina’s energy customers – individuals and families – paying more, a burden that disproportionately affects the poor.
So if solar develops naturally as a cost-effective, clean, reliable source of renewable energy that can be a significant part of our overall energy mix, then that’s great. (And in that case, we’d see a fairly even spread across the country.) But the use of taxpayer money to artificially inflate production in North Carolina hurts us all.